Flynet’s terminal emulator improves InBev's host MRP applications, further increasing productivity...
info@flynet.email. US: +1 617-778-7259. UK: +44 (0)3333 110 370.

info@flynet.email. US: +1 617-778-7259. UK: +44 (0)3333 110 370.
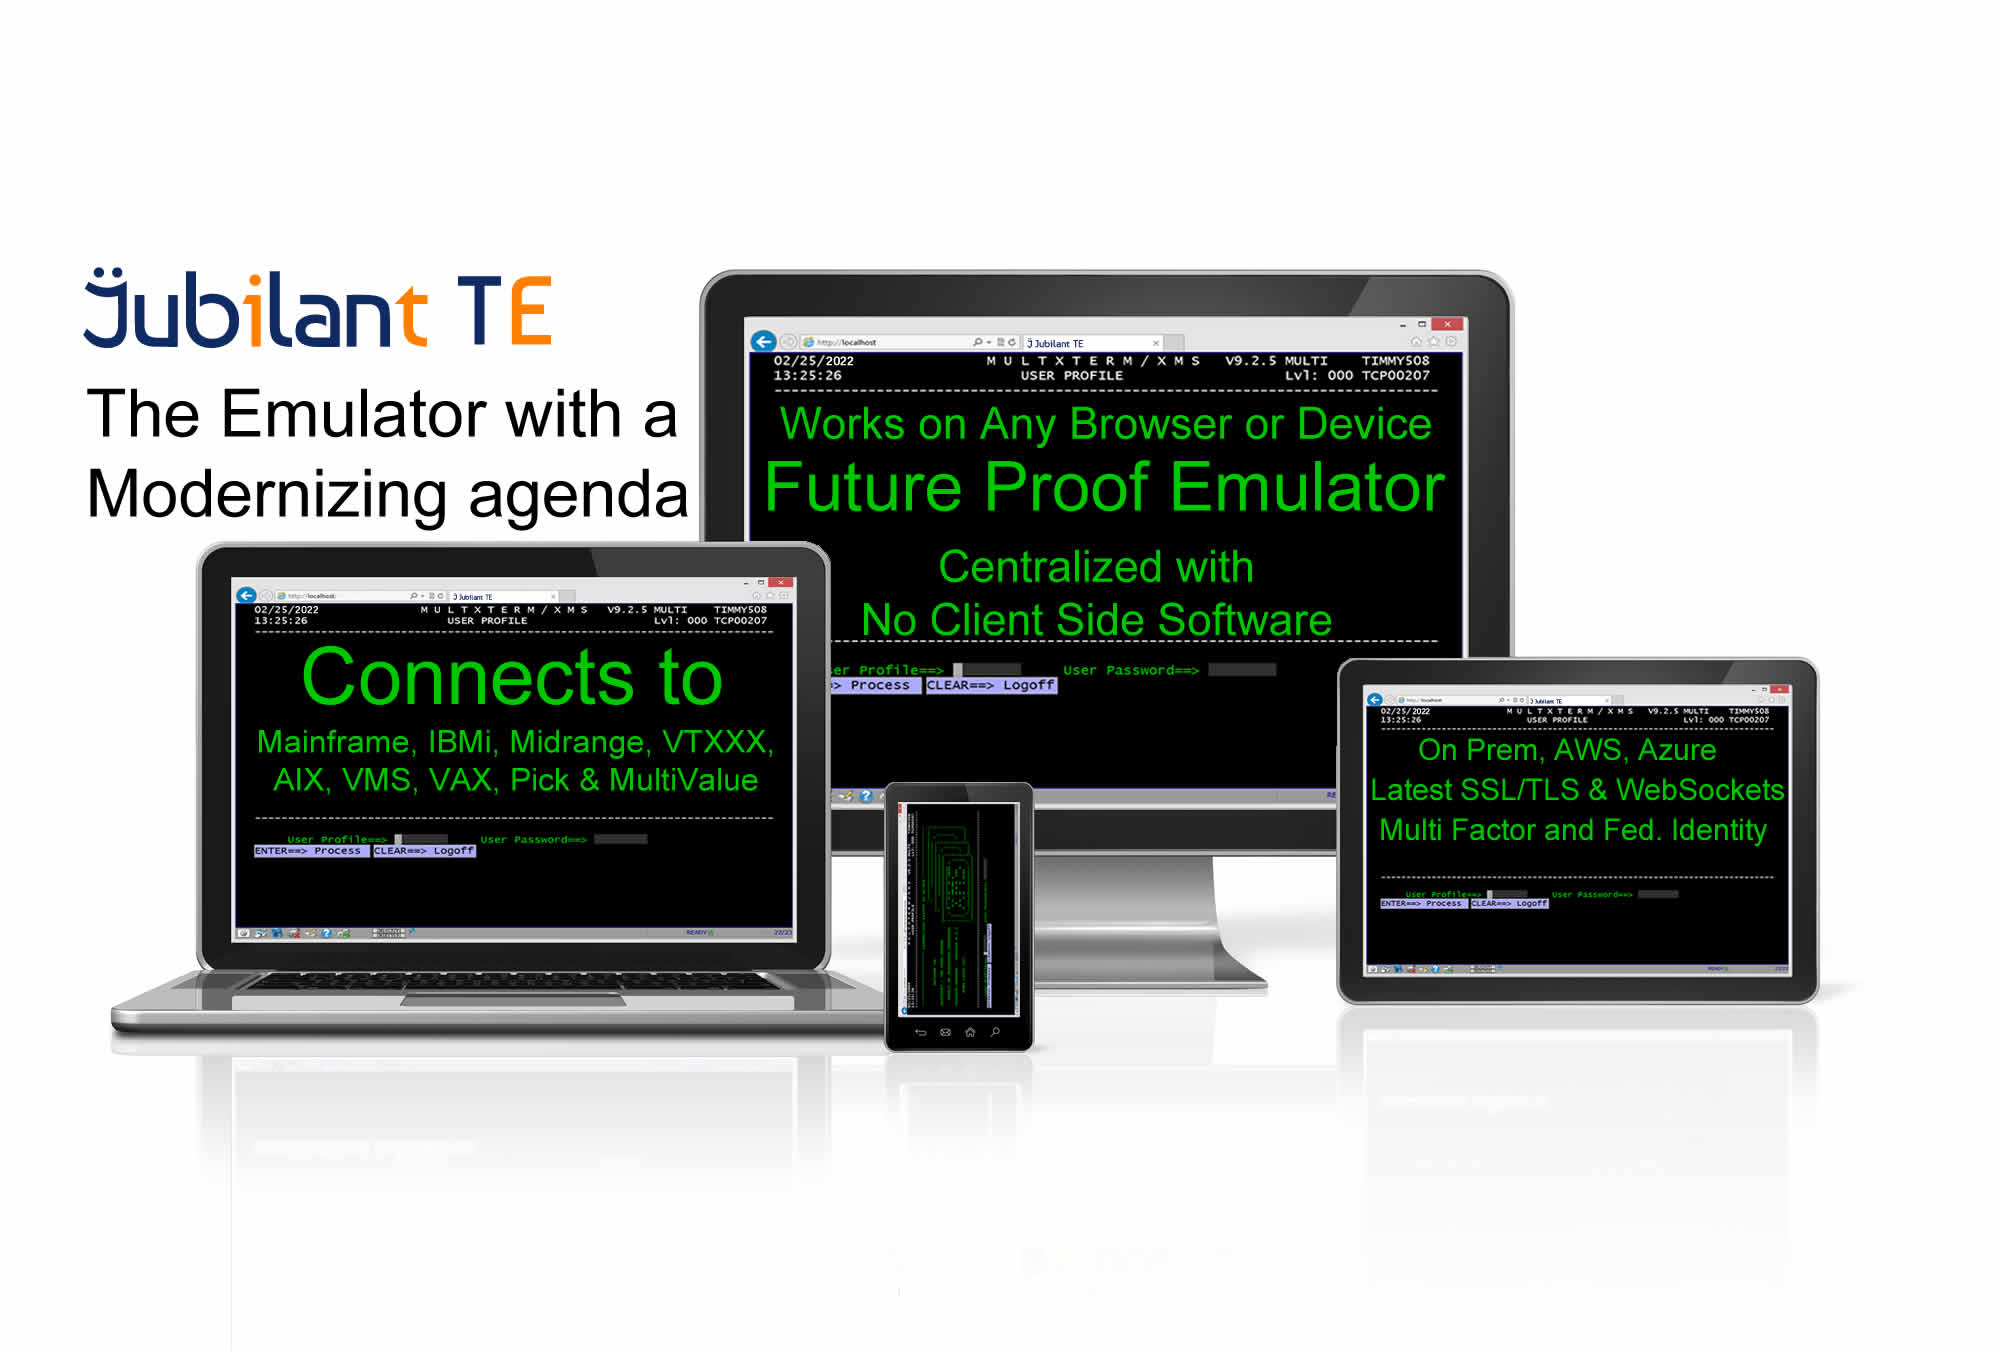
Jubilant™ Terminal Emulator provides an instant web browser based terminal emulator to key business systems, including Mainframe, iSeries, Unix, VMS or multivalue system, on any device with zero client software installation, all centrally managed via the Jubilant administration center. Jubilant supports client and server side macro creation and keyboard remapping out of the box.

Jubilant UX Modernization is a No Code and Low Code Platform that allows you to reshape how you interact with your Mainframe, iSeries, Unix, VMS or multivalue system, changing green screen user experiences into contemporary interfaces that are delivered over the web. This gives you the freedom to adapt and evolve business processes, quickly realising new efficiencies and gaining instant ROI and tactical advantages that are simply not available elsewhere, what’s more, this can be done by a super user or Citizen Developer.

The Jubilant WS (Web Services) Generator is a WYSIWYG W3C WebService generator for Mainframe, iSeries, Unix, VMS and Multivalue systems. It transforms your host environment into a dynamic component of your business systems interface layer, normally confined to the transaction layer of the enterprise, these new tools will unleash your investment in your host system to freely interact with and feed tertiary business systems, increasing the availability, timeliness and integrity of key business data.
Flynet’s terminal emulator improves InBev's host MRP applications, further increasing productivity...
The following was contributed solely by DAF "DAF needed to source a new terminal emulation solution...
In addition to delivering software, Flynet’s terminal emulator can provide full turn key packages of...

With Flynet’s terminal emulator Tesco have successfully implemented a major strategic initiative to...
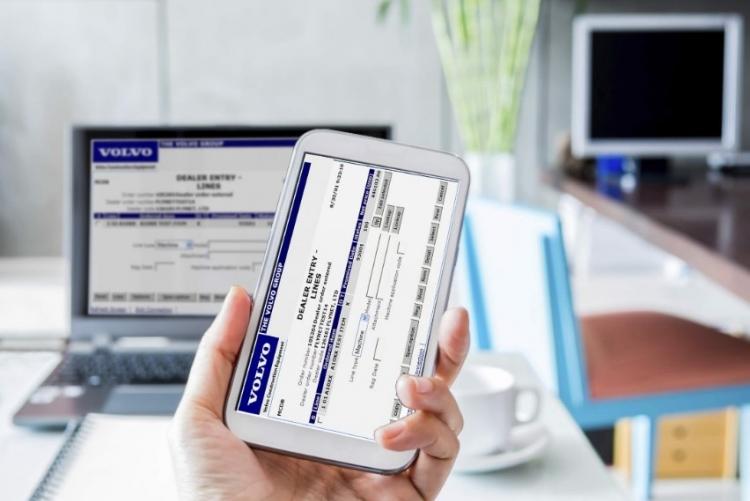
When Volvo Construction Equipment needed to improve dealers' access to its order management systems...
HSH Nordbank (formerly Hamburgische Landesbank) runs a successful screen-based electronic banking...

Mainframe, iSeries, Unix and Multivalue modernization and migration consultant workshop consultation...

Jubilant partners with SAP, IBM, Microsoft, IGEL, CAP Gemini and TMaxSoft for Mainframe, iSeries,...

Mainframe, iSeries, Unix and Multivalue and modernisation and migration software deployment with...